From Forecast to Published Schedule in Minutes
The QuNeva planning cycle end to end — import volumes, compute Erlang staffing requirements, build shifts, generate an optimized schedule, and publish it with notifications.
Planning a contact-center schedule traditionally means a week of spreadsheets: export volumes, run Erlang somewhere, hand-build shifts, argue about breaks, email a PDF. QuNeva compresses that into one pipeline where each stage feeds the next. Here's the walk-through.
Step 1 — Bring in your volumes
Historical volumes come in per channel (voice, chat and more) via Excel import or a feed. The Forecast studio lets you build and save forecast plans on top of them, and — because this is a MENA-first platform — Hijri dates, prayer windows, Ramadan and special-event windows shape the curve as engine inputs.
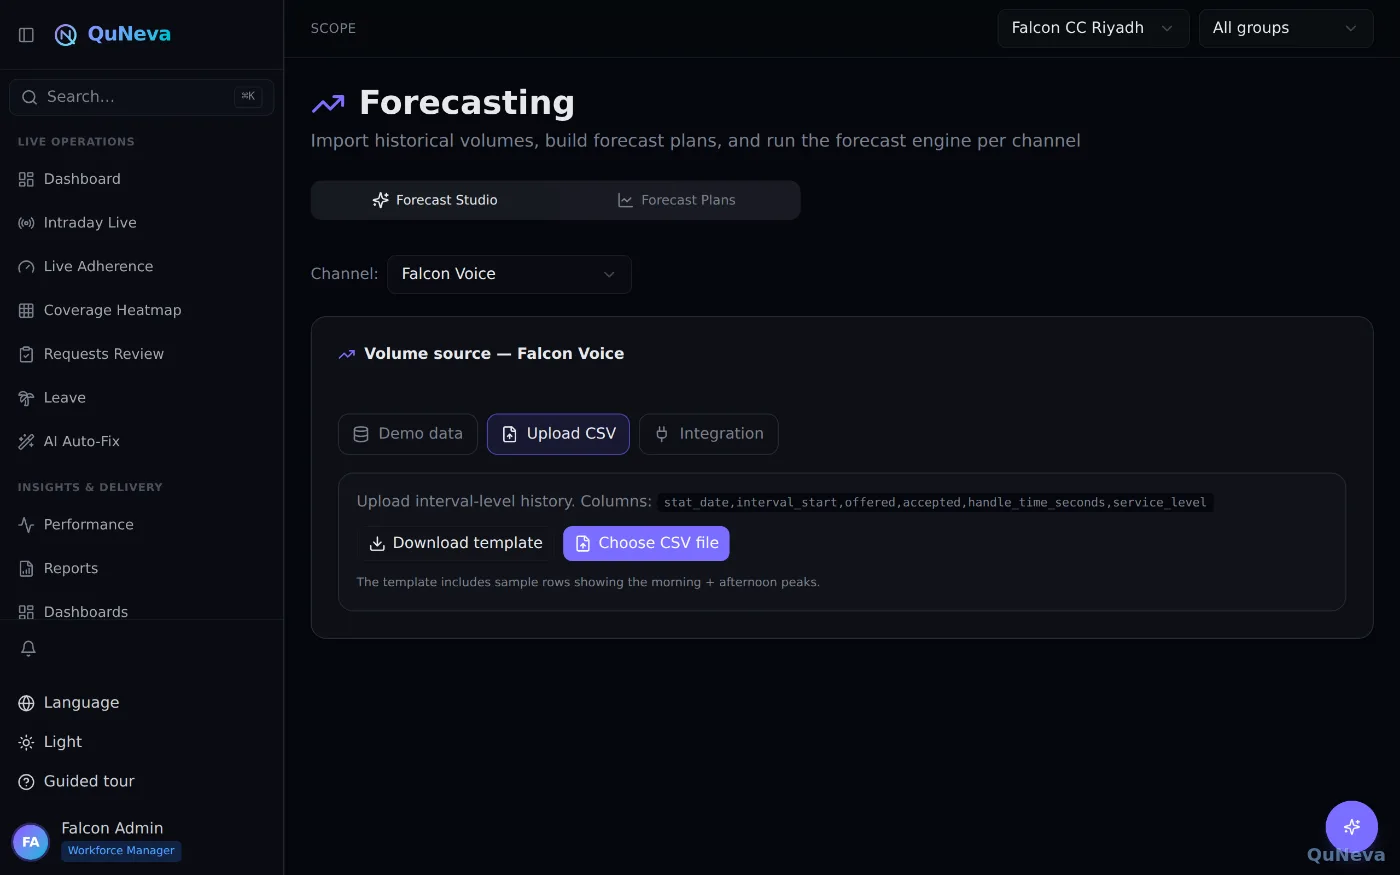
Forecast quality isn't taken on faith: MAPE, WMAPE, MAE, RMSE and bias are computed over elapsed days, so you know exactly how much to trust next week's curve.
Step 2 — Let Erlang answer "how many people?"
From volumes and handle times, QuNeva computes staffing requirements per interval using Erlang traffic models, then rolls them into capacity plans with shrinkage — including batch headcount planning for hiring waves. No copy-pasting into a calculator; the requirement column is simply there, per interval, per day.
Step 3 — Design the work: shifts and rotations
Work plans define what a working day looks like: start windows, break and lunch layouts, constraints. The visual shift builder makes this a design task rather than a data-entry task, and multi-week rotations advance always-forward so agents aren't trapped in the same pattern forever.
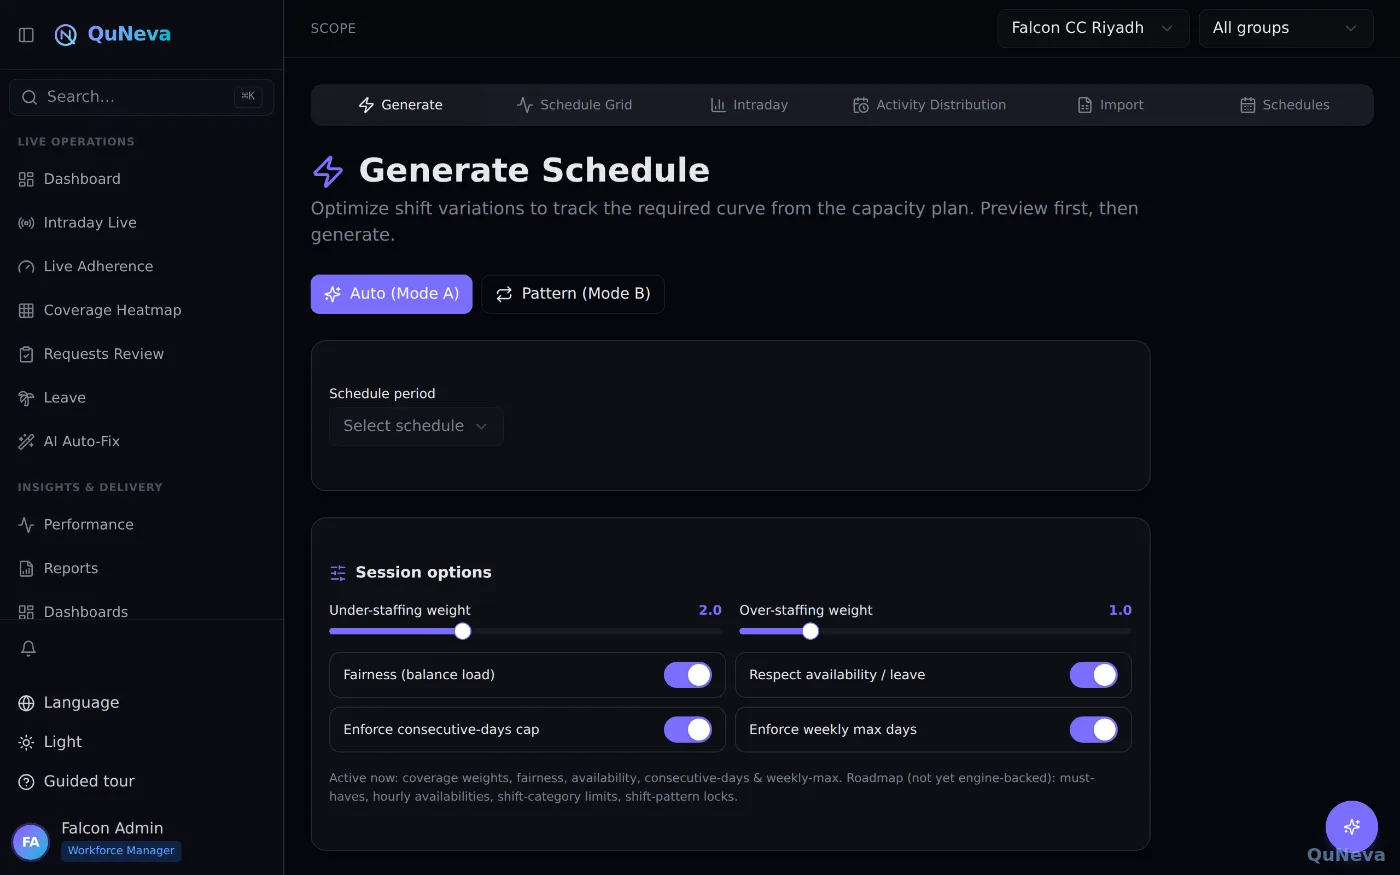
Step 4 — Generate the schedule (three ways)
- Constrained optimizer — builds the schedule from your work plans, preferences and rules.
- Rotation patterns — for operations that run on fixed repeating cycles.
- Excel import — for teams migrating gradually from spreadsheets.
The grid supports locking and manual edits, and a Planning Wizard walks the whole cycle end to end for guided runs.
Step 5 — Check coverage before anyone works a minute
The coverage heatmap compares scheduled versus required staff for every interval: red where you're under, green on target, amber over. Weekend and Ramadan overlays are right there, so the "why is Tuesday red?" conversation happens before publish, not after service level dips.
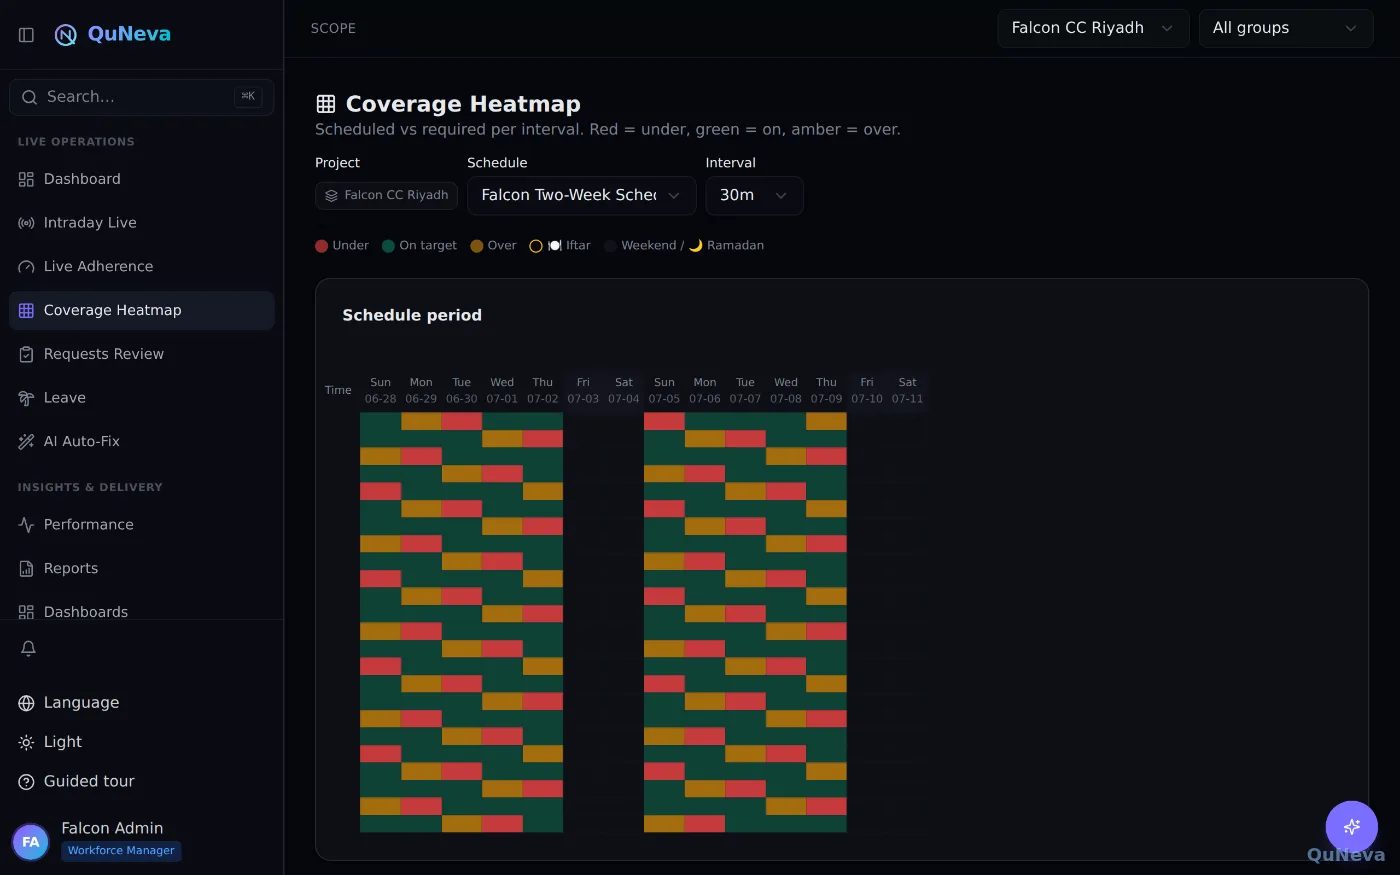
If a span is overstaffed, the AI auto-fix can trim it without breaking coverage — with a snapshot and one-click revert.
Step 6 — Publish, and let agents see it instantly
Publishing notifies agents; each agent sees their own days, segments and breaks in their portal — in Arabic or English:
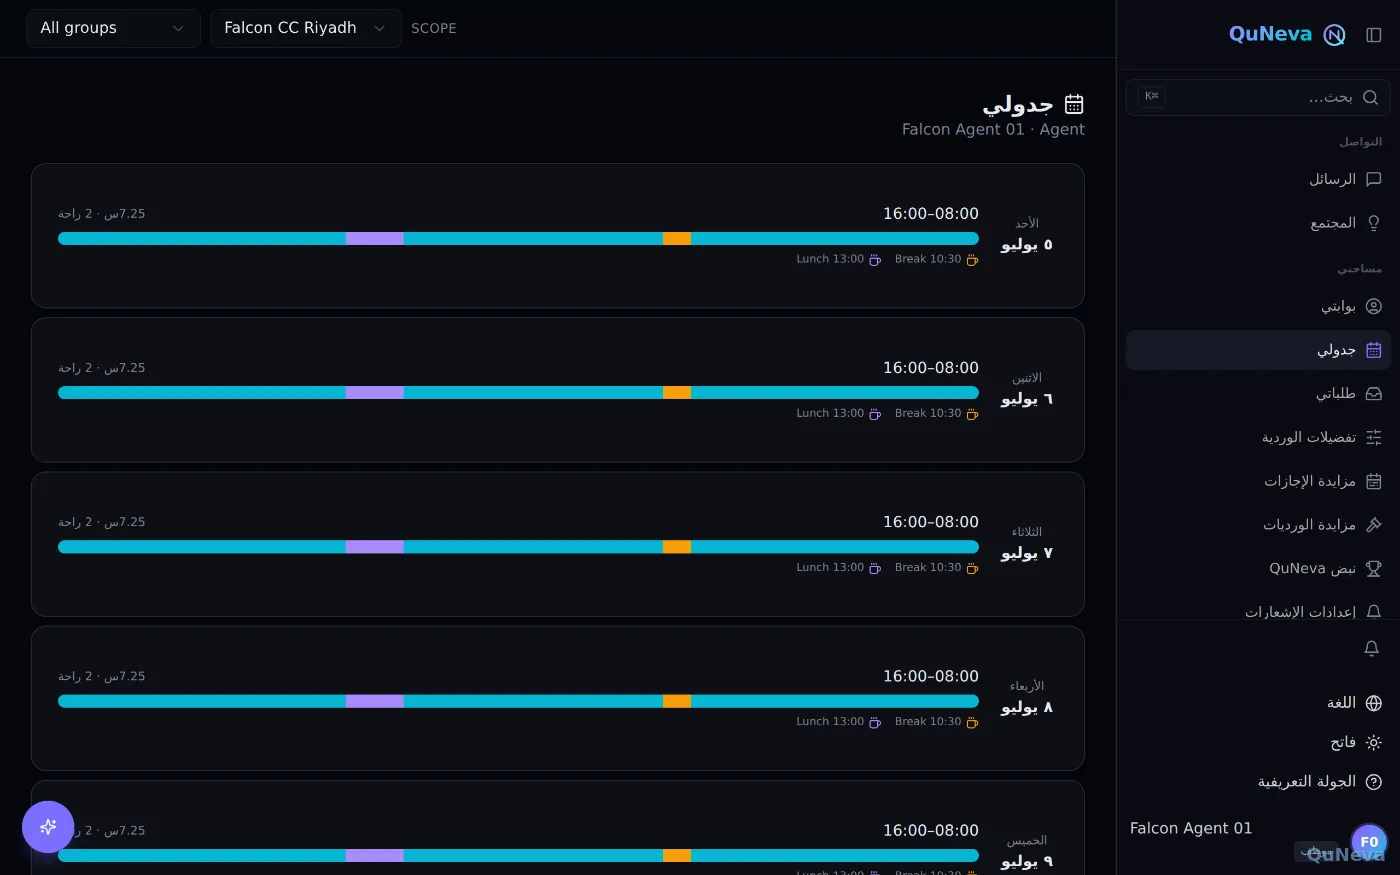
From there, the day-to-day questions ("what's my shift tomorrow?") don't even need the screen — the AI assistant answers them from the same published data.
The point
Forecast → staffing → shifts → schedule → coverage → publish is one connected pipeline, not five tools taped together. That's what makes minutes realistic — and it's included in the free-to-start platform.